How long is the coastline of Wisconsin? The answer to that question is … it depends! This post will try to explain some of the challenges in coming up with a single, definitive answer.
Official Estimates
As far as official estimates of coastline length go, the best bet is probably NOAA (the National Oceanic & Atmospheric Administration). According to on this NOAA document, Wisconsin’s Great Lakes coastline is 820 miles (1,320 km) in length. The document states,
For the Great Lakes, shoreline mileage was measured in 1970 by the International Coordinating Committee on Great Lakes Basic Hydraulic and Hydrologic Data and cross-referenced with U.S. Lake Survey measurements for each state. In all cases, mileage was determined by using a recording device on large-scale charts.
Also relevant is this NOAA document, which says,
There is no legal reference that designates one specific shoreline as the legal shoreline. Furthermore, there is no simple answer to this question as there are many legal, technical, and general uses of the terms related to shoreline (shoreline, coastline, baseline, mean high-water line, mean-low water line, etc.)
Other coastline length estimates vary widely. For example, this Wikipedia page states that along the two Great Lakes, Wisconsin has over 500 miles (800 km) of coastline. The page cites Lawrence Martin’s “Physical Geography of Wisconsin” textbook, originally published in 1916, as the source of the number.
Meanwhile, Encyclopedia Britannica says that “Wisconsin has about 400 miles (640 km) of shoreline along Lake Michigan and some 150 miles (240 km) along Lake Superior.” That gives a total of 550 miles (about 880 km).
Google’s experimental Generative AI answer is: “Wisconsin has over 800 miles of shoreline on Lake Michigan and Lake Superior, which includes 175 miles of the Apostle Islands shoreline.”
Here are some other answers.
“In Wisconsin, there are over 1,000 miles of Great Lakes coast on Lake Michigan and Lake Superior.”
“Wisconsin has 407 miles of Lake Michigan coastline and 325 miles of Lake Superior shore frontage.”
“Wisconsin’s harbor towns are dotted along 1,100 miles of coastline.”
Why is it so difficult to nail this number down? And what’s the correct answer?
Scale and Resolution
If you are going to measure the length of the state’s coastline, you will need to use a map — probably a digital one. (It would be a bit impractical to run a tape measure from the city of Superior all the way to the Wisconsin-Illinois border south of Kenosha.) There are several sources of uncertainty when using a map for this purpose, including the map scale, generalization level and length distortion.
Another important issue, which we will leave behind for the time-being, is a definitional one: “What is the coastline?” Does it include only natural shoreline, beaches and bluffs, or also piers, breakwaters and groins? The answer can have a significant impact on coastline estimates.
We will consider the scale problem first. If you are familiar with maps, it will probably be obvious to you that larger-scale maps will produce longer coastline estimates, due to the additional physical details shown. This is in fact a well known principle of cartography that most map-makers would recognize intuitively. The effect has even been quantified. For example, Töpfer and Pillewizer (“The principles of selection,” The Cartographic Journal, 1966, 10-16) provide a graph of coastline length measured on maps of different scales, showing that the relationship is “parabolic” in shape, such that length declines with decreasing scale, but at a decreasing rate. (Fig. 1)
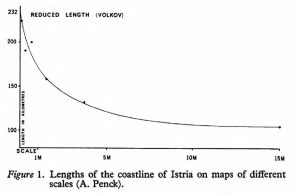
Fig. 1. Coastline length vs. map scale from Töpfer and Pillewizer (1966)
Taking this one step further, if you believe in the concept of “statistical self-similarity,” then at the largest scale, Wisconsin’s coastline is infinite in length. The idea of statistical self-similarity was originally put forward by Benoît B. Mandelbrot at IBM in his 1967 article on fractals (“How long is the coast of Britain? Statistical self-similarity and fractional dimension,” Science, 1967, 636-638). Mandelbrot produced space-filling cartographic lines by recursively subdividing a segment of a line and replacing it with a reduced-scale image of the whole. Such lines have a fractional dimensionality between 1 and 2 (hence the term fractal). After an infinite number of replacements at ever-smaller scales, the length of the limit curve becomes infinite, even though it is still a line.
Mandelbrot’s work expanded on the work of L. F. Richardson, whose 1961 article (“The problem of contiguity: an appendix to statistics of deadly quarrels,” General systems yearbook, 1961, 139-187) showed that the length of cartographic lines tends to increase as the “step-size” of the divider used to measure the length of the line decreases. (This was in the days before computer mapping, when the length of a cartographic line would have been computed by counting the number of steps made by a pair of dividers with the points at a known distance or “step-size”.) Step-size is another way of operationalizing map scale: The larger the step-size, the smaller the scale, and vice versa. Richardson also showed that the rate at which line length increases is not always the same, depending on a measure of line complexity.
Empirical Results
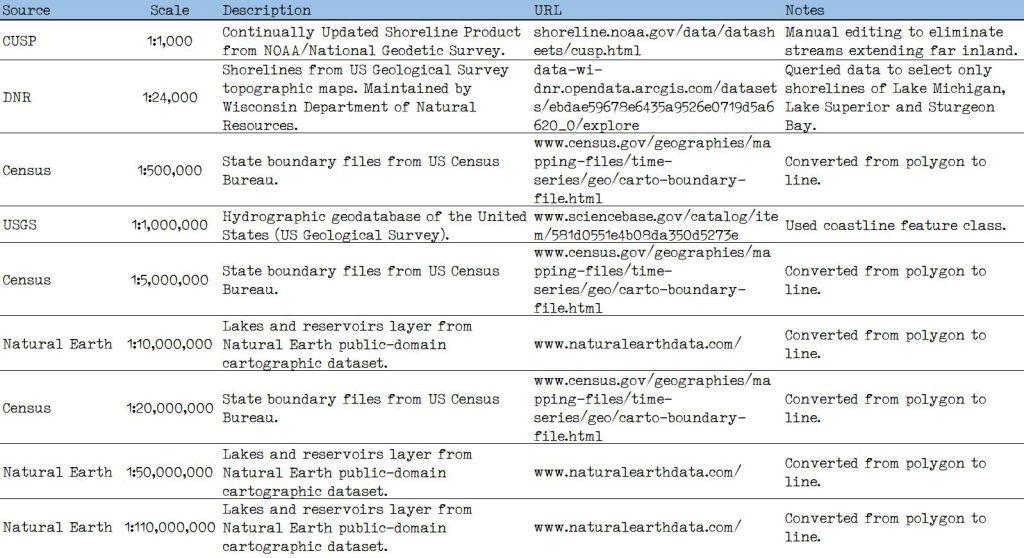
These comments indicate that the length of the coastline measured from a map will depend on the scale of that map. To quantify this effect for Wisconsin, I measured the length of the state’s Great Lakes coastline (along Lake Superior and Lake Michigan, including Green Bay and Sturgeon Bay) on nine digital maps at scales ranging from 1:1,000 to 1:110,000,000. Details are given below in Table 1.
Here are the links from that table: CUSP DNR Census USGS Natural Earth
In all cases, the coastline of the state was clipped to extend from a) the western tip of Wisconsin Point near the city of Superior to the Wisconsin-Michigan border along Lake Superior, and b) the Wisconsin-Michigan border at the mouth of the Menominee River to the Wisconsin-Illinois border south of Kenosha, via Door County.
Figure 2 compares the nine different maps using a close-up of the coast near Milwaukee. As expected, the level of detail shown declines as scale decreases.
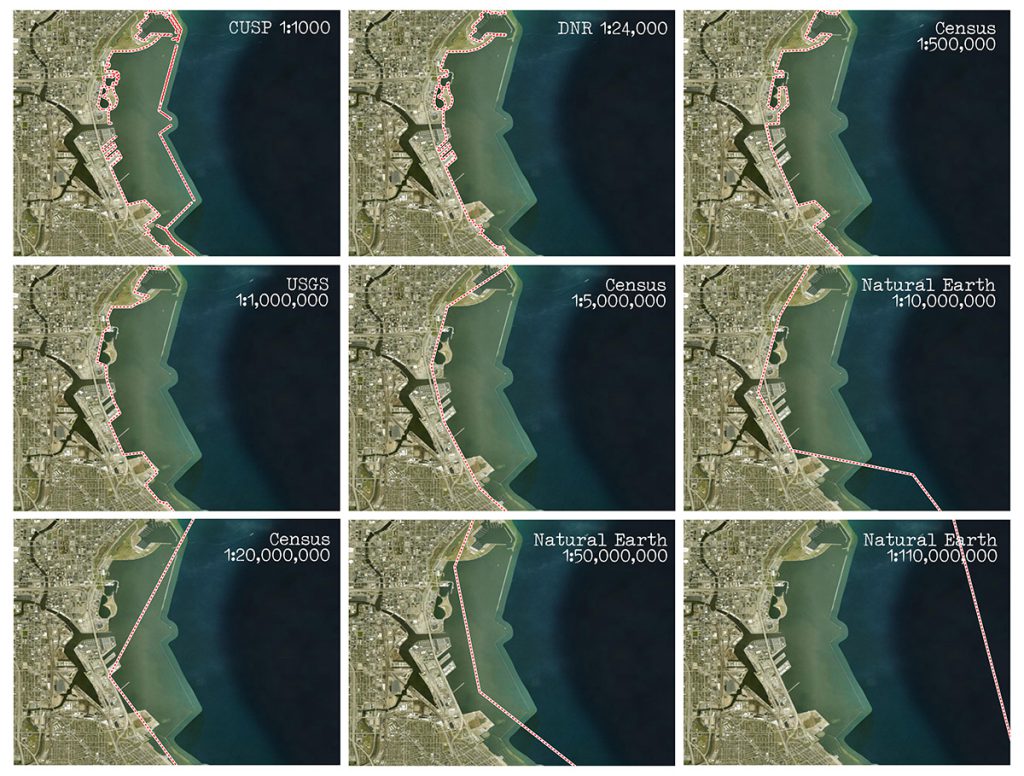
Fig. 2. Comparison of coastline on maps of different scales, Milwaukee
To compute coastline length, I used ArcGIS Pro to calculate geometry for each set of lines. I used the geodesic option to eliminate the effects of map projection. (See this page for more details.) Results are shown in Table 2.
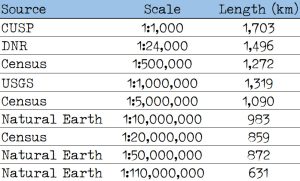
Table 2. Wisconsin Great Lakes coastline length estimates from maps of different scales
Not surprisingly, the larger scales give longer estimates. The 1:1,000-scale CUSP data yields an estimate of 1,703 km, almost three times the estimate derived from the smallest-scale map (Natural Earth at 1:110,000,000). This is a very wide range. In addition, the CUSP and DNR estimates are several hundred kilometers longer than the “official” NOAA estimate of 1,320 km. The NOAA estimate is very close to the value for the USGS 1:1,000,000 map (1,319 km). Some of the other estimates of coastline length quoted earlier are in line with map scales on the order of 1:20,000,000 or smaller.
Figure 3 shows a graph of coastline length versus scale for the source maps. The curve is very similar to Figure 1 from Töpfer and Pillewizer. Estimated coastline length declines as map scale decreases, but at a decreasing rate. Figure 3 includes a trend line fitting an exponential equation, where the R-squared value is 0.88, indicating a good fit. This equation could be used to predict the coastline length estimate for a map between the endpoint scales of 1:1,000 and 1:110,000,000.
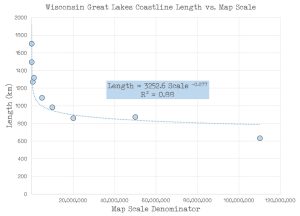
Fig.3. Graph of Wisconsin Great Lakes coastline length estimates vs. map scale
Since the “true” coastline is at a scale of 1:1, we would expect it to be even longer than the estimate of 1,703 km from the CUSP map. The only difficulty with this statement is that we do not know exactly how much longer, as we do not have a 1:1 map. In addition, at the detailed scale of the CUSP map, the definitional problem of what constitutes the coastline comes strongly into play. As shown in Figure 2, for example, the coastline estimate for CUSP includes breakwaters, jetties, wharfs, bulkheads, and other human-made features. On smaller scale maps, these features are often highly generalized and therefore not discernible.
Map Generalization
Similar changes in coastline length estimates can occur if map data is generalized. To demonstrate this effect, I used ArcGIS Pro’s “Simplify Line” tool with the Douglas-Peucker simplification algorithm (D. H. Douglas & T. K. Peucker. “Algorithms for the reduction of the number of points required to represent a digitized line or its caricature,” Cartographica, 1973, 112-122). This algorithm removes vertices within a specified tolerance band to reduce line complexity. Table 3 shows the resulting coastline estimates for the 1:24,000 DNR coastline layer, with generalization tolerances ranging up to 10,000 meters. The result is a decline in length as generalization tolerance increases (more generalization), but at a decreasing rate.
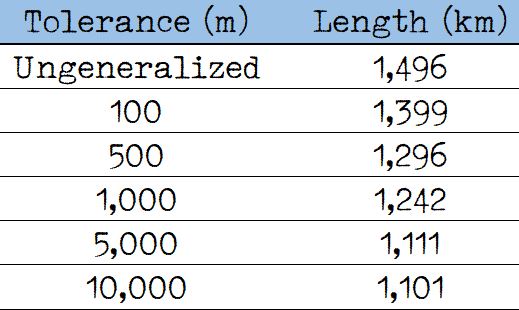
Table 3. Length estimates for the 1:24,000 DNR coastline layer at different generalization levels
The effect of generalization is very similar to the effect of map scale.
Map Distortion
The results described here are largely free from the effects of map distortion, since all distance calculations in ArcGIS Pro are based on the geodesic method, which computes distances between two points on the sphere rather than a 2-dimensional map. However, if we calculated lengths using projected map coordinates, the results could be quite different. The problem is that while there are map projections that preserve shape (“conformal” projections) and map projections that preserve area (“equal area” projections), there are no map projections that preserve length in all directions at all points on the map. Conformal projections distort lengths equally in all directions for any given point, but not from one point to the next. To preserve area, equal area projections introduce length distortion that varies with direction and from point to point.
Table 4 shows the length of the 1:24,000 DNR coastline on several different projections.
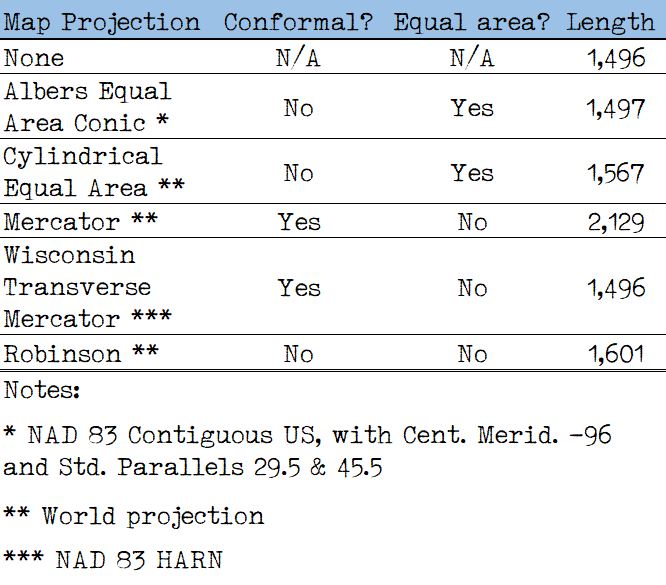
Table 4. Length estimates for the 1:24,000 DNR coastline using different map projections
The only conclusion to draw from these data is that you should always avoid computing distances on a projected map. This is even true when considering WTM (Wisconsin Transverse Mercator). While this projection performs well in this example (to understand why, see this earlier post) but this is no guarantee that accuracy will always be achieved. Neither conformal nor equal area projections can be used reliably for length estimates, and compromise projections such as Robinson do not necessarily perform well either.
One caveat: At large scales under conditions in which distortion parameters are known, it is possible to use projected maps to measure lengths, often in conjunction with correction factors (scale factor and elevation factor). Hopefully, this will be the topic of a future post.
And in Conclusion…
It would be satisfying to give a single, definitive value for the length of the Great Lakes coastline of Wisconsin. As I have tried to show, this is difficult to do, for a number of reasons. Hopefully, this post has given you some additional background you can use to critically evaluate the accuracy of statements of coastline length for Wisconsin, or another location.

